The divorce rate in the United States has fallen over the past two decades, but so has the marriage rate. We’ll share divorce statistics and divorce rates by occupation, age, and state.
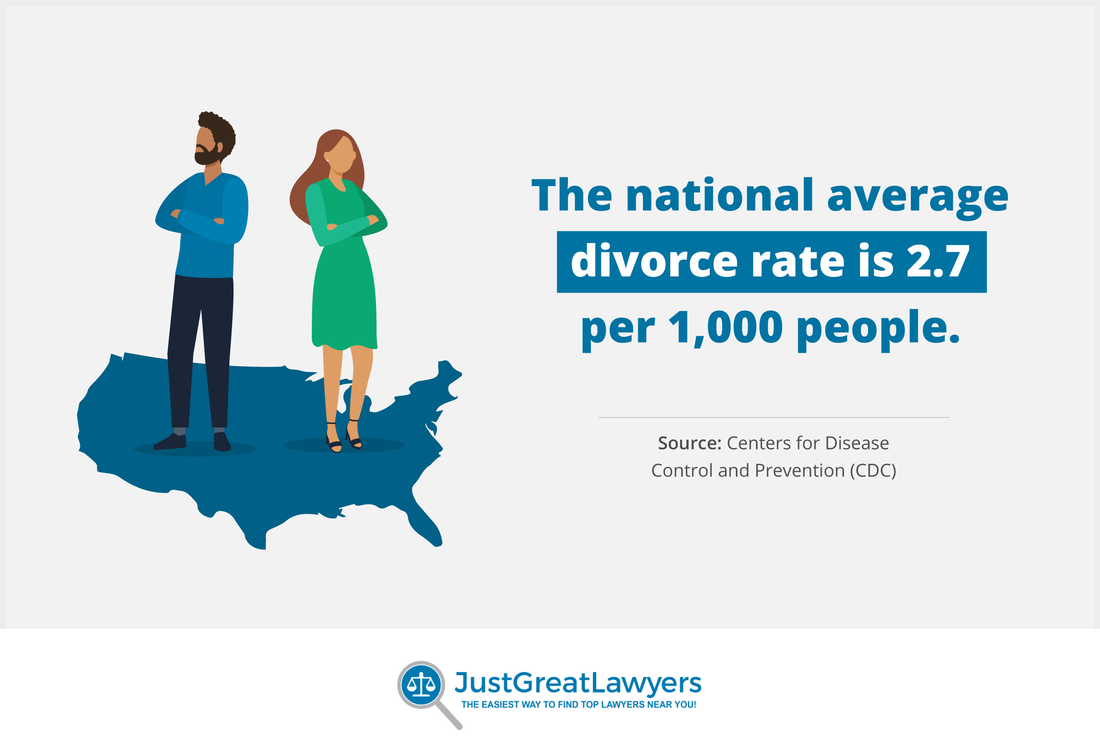
According to the CDC (The Centers for Disease Control and Prevention), the national average divorce and annulment rate in 2019 was about 2.7 per 1,000 people.
The divorce rate is down significantly from 2000 when it was 4.0 per 1,000 people.
The rate of marriages has also declined. There were 8.2 marriages per 1,000 people in 2000 and 6.1 per 1,000 people in 2019.
Fewer people are getting divorced, but fewer people are getting married, too. As a percentage, the crude divorce rates in the aforementioned years were:
49% in 2000
44% in 2019
The crude divorce rate is useful for describing changes in the U.S. divorce rate over time, but it does not provide accurate information on first marriages that end in divorce. Rather, it calculates any divorce that happened that year.
Employment and the different stressors that go with it can put a strain on marriages. As we’ll see below, money is the third-most-common factor leading to divorce.
Salaried positions, where income is stable and generally higher, seem to bolster the chances of having a lasting marriage. The least likely professionals to get divorced are:
Actuaries: 17%
Physical scientists: 18.9%
Medical scientists and life scientists: 19.6%
Clergy: 19.8%
Software developers: 20.3%
Physical therapists: 20.7%
Optometrists: 20.8%
Chemical engineers: 21.1%
Religious and education directors: 21.3%
Physicians and surgeons: 21.8%
But as the list below indicates, money isn’t the only factor involved. Work atmosphere also seems to play a role. The professions where worker marriages are most likely to end in divorce are:
Gaming and casino managers: 52.9%
Bartenders: 52.7%
Flight attendants: 50.5%
Gaming services workers: 50.3%
Rolling machine setters: 50.1%
Switchboard operators: 49.7%
Extruding machine operators: 49.6%
Telemarketers: 49.2%
Textile knitting operators: 48.9%
Compacting machine operators: 48.8%
Since workers at casinos and in gambling-related jobs rank at or near the top of the most divorce-prone employees, it should be no surprise that this is reflected geographically.
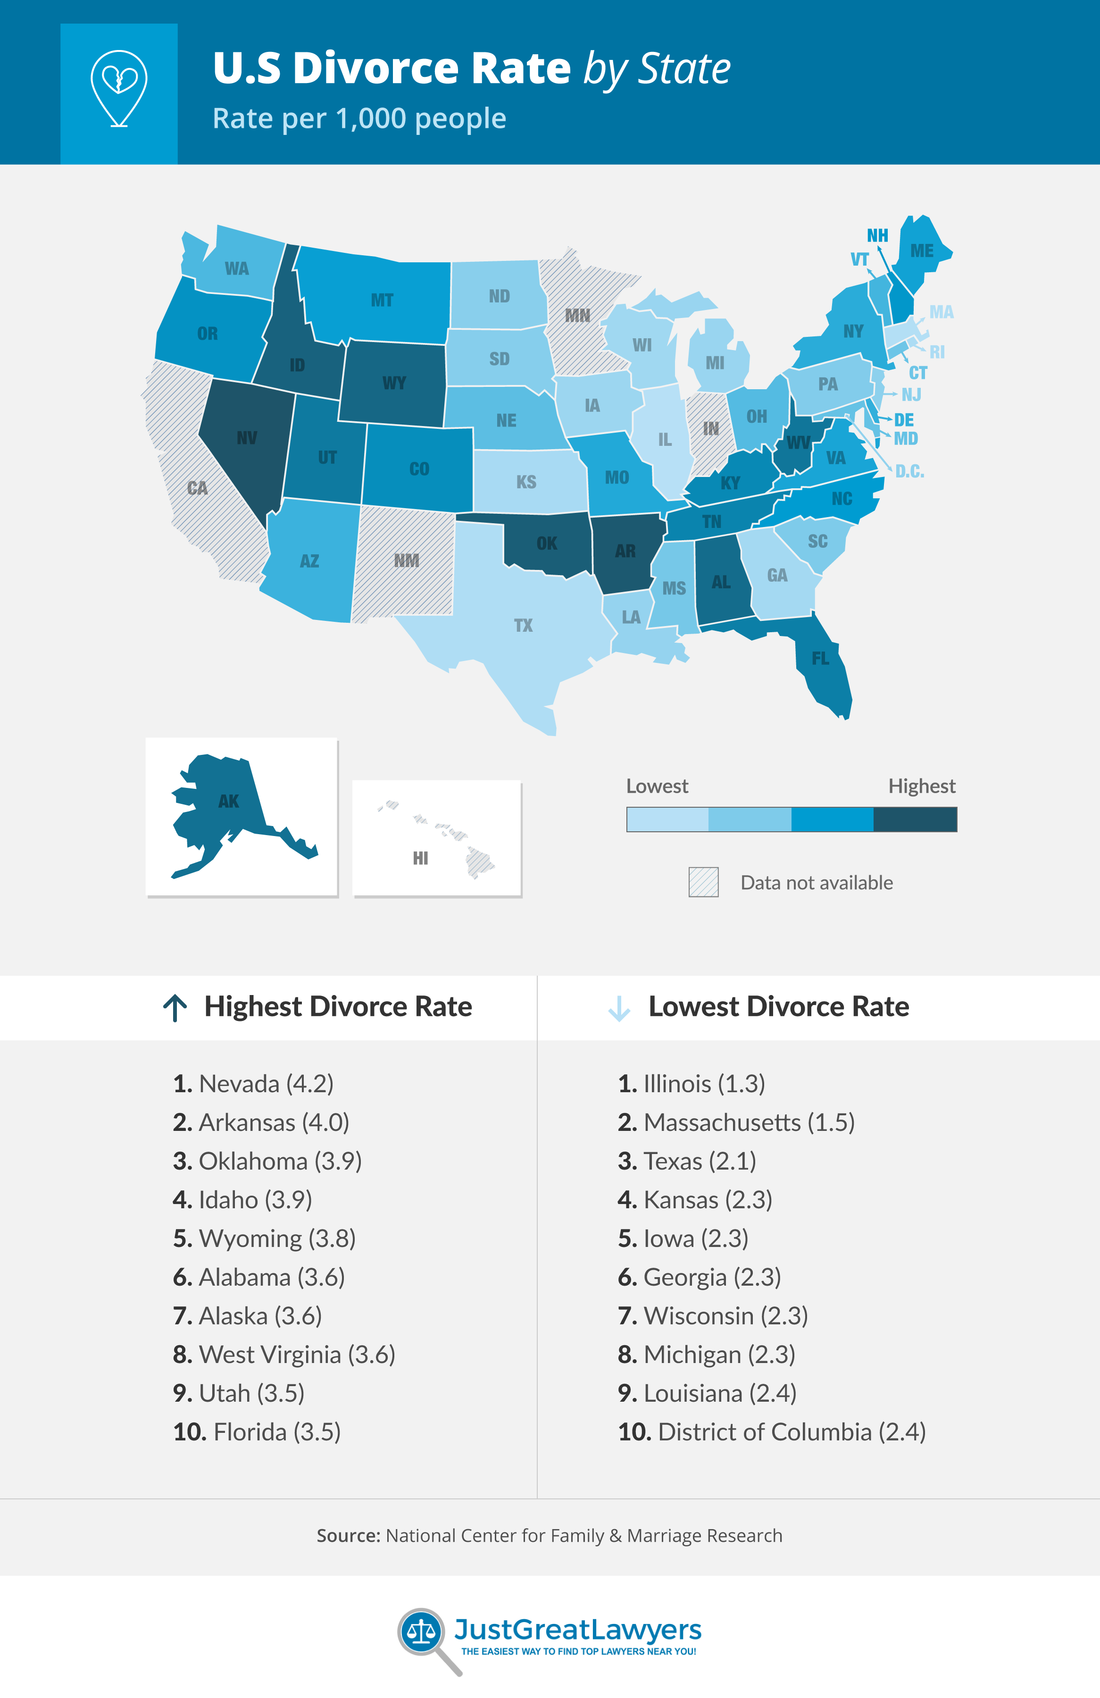
Nevada, the gambling capital of the U.S., ranked at the top of the list for divorce at 4.2 divorces per 1,000 people in 2019.
Nevada, like neighboring California, is a no-fault divorce state, so people who want to get a divorce don’t need to provide a reason for doing so.
Nevada also led the nation in marriages. The idea of heading to Las Vegas to elope isn’t just a cliché. You can get married in Nevada on the spur of the moment because you can start the ceremony immediately after obtaining a license.
Nevada (4.2)
Arkansas (4.0)
Oklahoma (3.9)
Idaho (3.9)
Wyoming (3.8)
Alabama (3.6)
Alaska (3.6)
West Virginia (3.6)
Utah (3.5)
Florida (3.5)
Illinois (1.3)
Massachusetts (1.5)
Texas (2.1)
Kansas (2.3)
Iowa (2.3)
Georgia (2.3)
Wisconsin (2.3)
Michigan (2.3)
Louisiana (2.4)
District of Columbia (2.4)
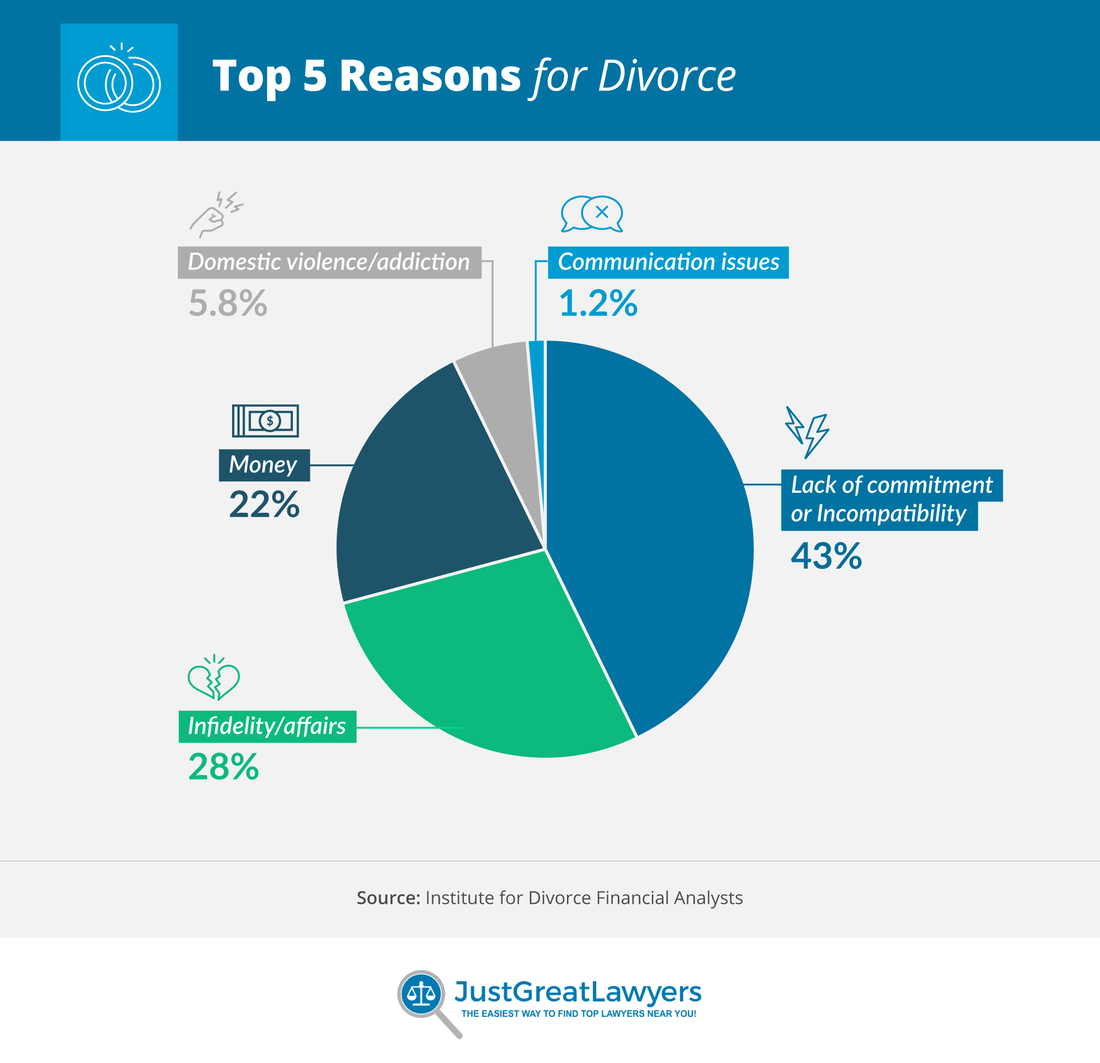
According to a study conducted by Certified Divorce Financial Analyst professionals, lack of commitment or incompatibility was easily the top factor leading to divorce.
In the survey:
43% of respondents cited lack of commitment or incompatibility as the cause of divorce, followed by infidelity/affairs at 28% and money at 22%.
Other factors, such as domestic violence or addiction (5.8%) and arguments or communication (1.2%) were less likely to cause divorce.
When couples do get married, they’re more likely to “get it right the first time” than they are to “learn from their mistakes.” Statistics show that:
Two-thirds of second marriages (67%) end in divorce.
Three-quarters (74%) of third marriages also end in divorce.
This is significantly higher than the 44% crude divorce rate in 2019.
From 1990 to 2017, the biggest decrease in the divorce rate was in the 15-24 age group. It fell from 47.2 per 1,000 people in 1990 to 27 per 1,000 people in 2017.
However, the 15-24 year old age range has the highest divorce rate of any age group.
The second-highest rate of divorce takes place in people ages 25-34, but it’s declining there, as well: down from 33.3 per 1,000 in 1990 to 23 per 1,000 in 2017.
The rate among 35-to-44-year-olds has remained fairly stable.
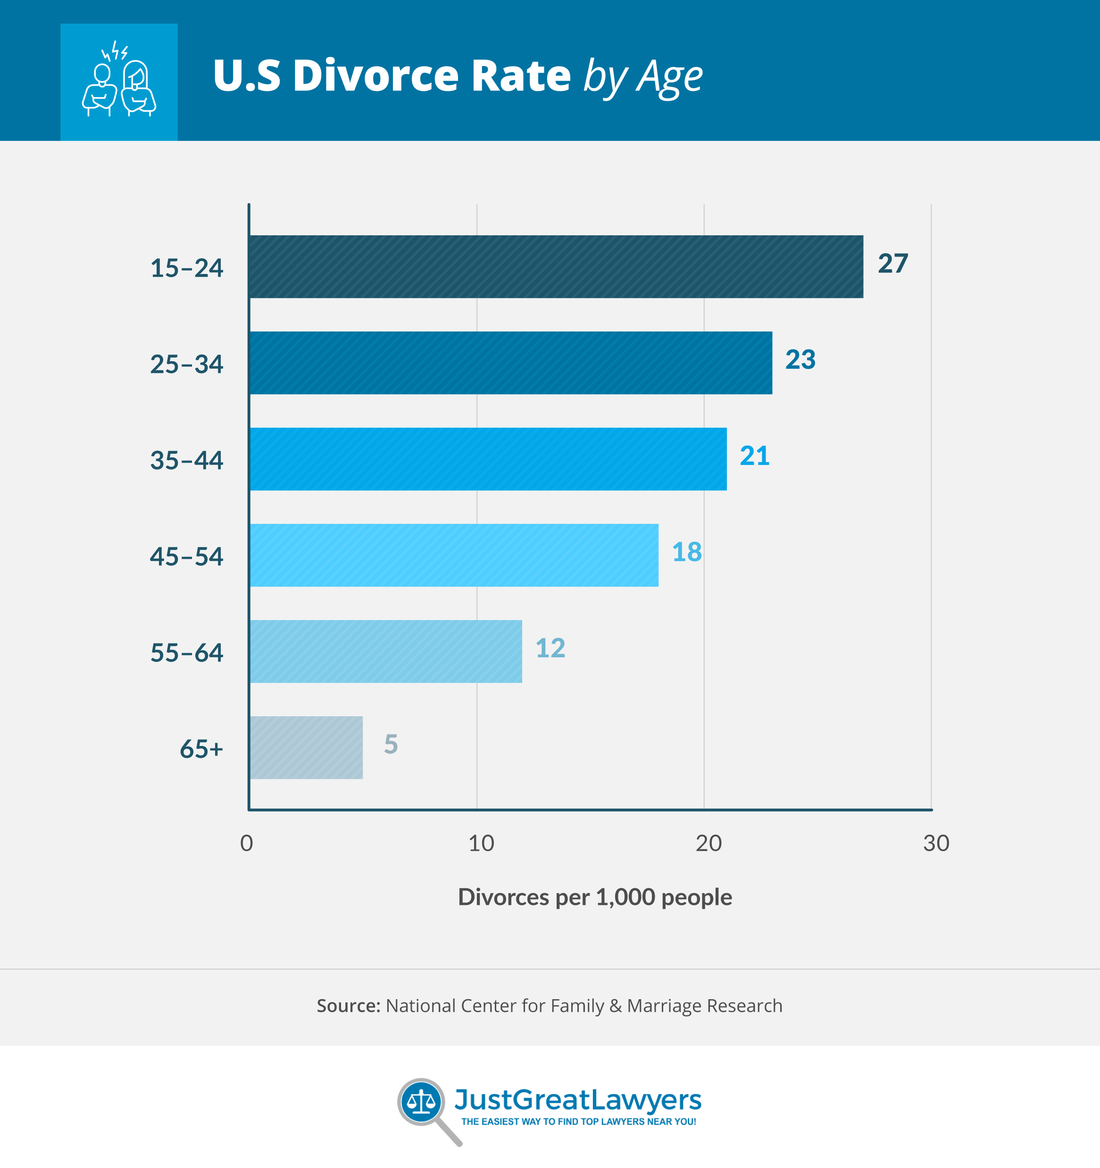
Following are the number of people per 1,000 who divorced in each of six age groups in 2017, according to the U.S. Census Bureau’s American Community Survey. According to the survey, the number of divorces per 1,000 people declines in a trendline through each 10-year age group and senior citizens 65 and older.
Ages 15-24: 27 divorces per 1000 people
Ages 25-34: 23 divorces per 1000 people
Ages 35-44: 21 divorces per 1000 people
Ages 45-54: 18 divorces per 1000 people
Ages 55-64: 12 divorces per 1000 people
Ages 65+: 5 divorces per 1000
The more educated you are, the more likely you may be to remain married. One notable statistic from the National Center for Health Statistics found that 78% of college-educated women were still married after 20 years, compared to barely half as many (40%) of women with high school diplomas.
Another study found that the marriage and divorce rates diverged increasingly with higher levels of education.
Less than high school: 16.4 divorces per 1,000 people
High school: 16.4 divorces per 1,000 people
Some college: 20.4 divorces per 1,000 people
Bachelor’s: 14.1 divorces per 1,000 people
Master’s: 12.5 divorces per 1000 people
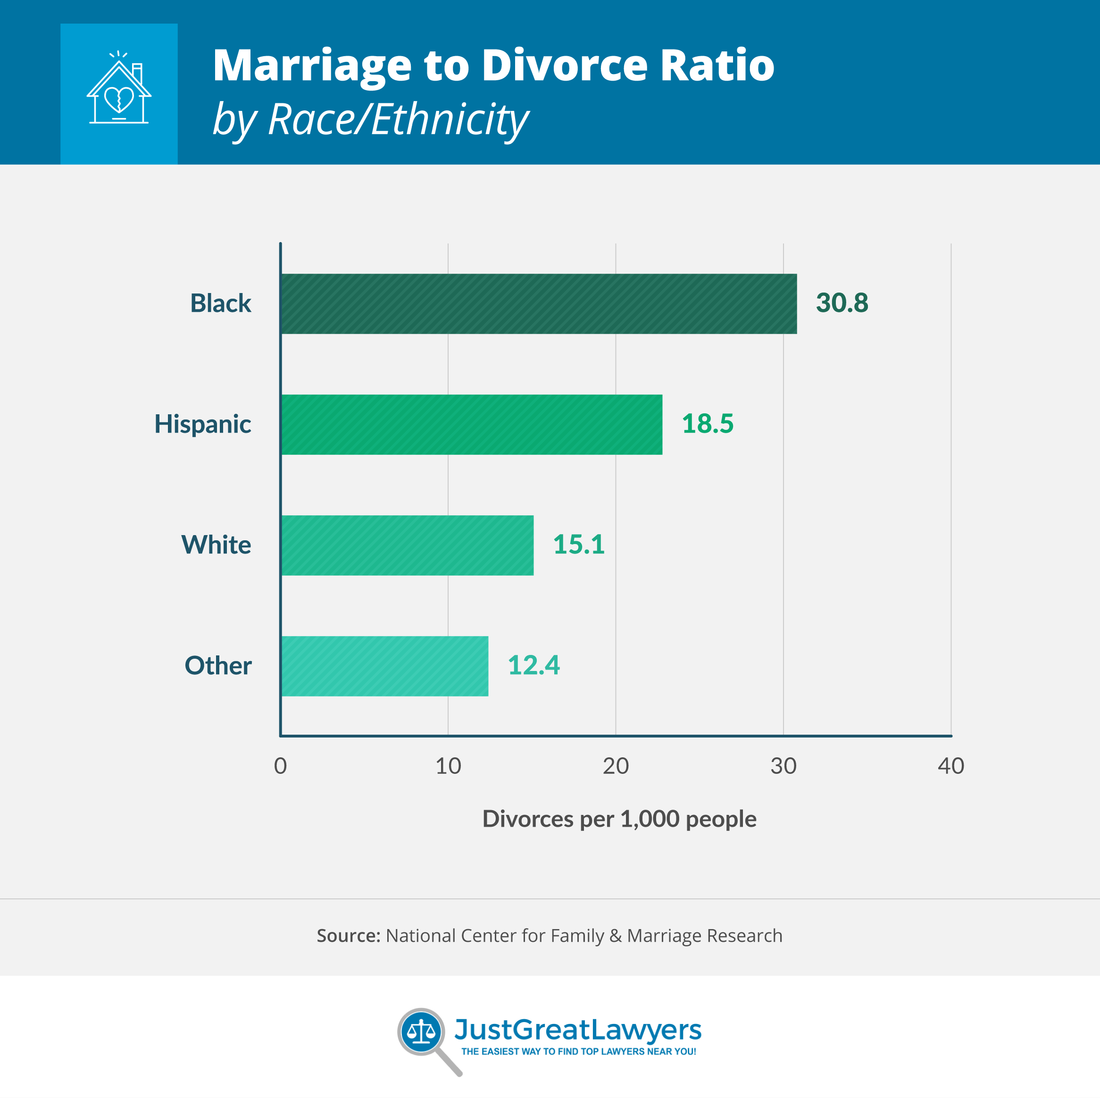 Black women are more likely to divorce (and to get married, for that matter) than women of other racial backgrounds. Divorce rates by ethnicity were as follows in 2018:
Black women: 30.8 divorces per 1,000 people
Hispanic women: 18.5 divorces per 1,000 people
White women: 15.1 divorces per 1,000 people
Others: 12.4 divorces per 1,000 people
Women are more likely to file for divorce than men for a variety of reasons. They may cite emotional well-being, unhappiness in marriage, the desire to pursue a career or the need for greater satisfaction.
As we have seen, money can be an issue contributing to the likelihood of unhappiness in a marriage and, ultimately, to divorce.
Among adults with low incomes, just 26% are married.
People with low incomes are the least likely to marry, but they’re also much more apt to substitute cohabitation for marriage (13%) than any other income group. They’re also at greater risk for divorce (46%).
54% of people in this group say they’re “very happy” in their marriages, about the same as say so in the working-class group (56%).
Among working-class adults, 39% are married and 41% have been divorced.
56% of people with mid-and upper-class incomes are married and 30% have been divorced.
65% of people in this group report being “very happy” in their marriages.
If you need help with or are looking for direction regarding divorce, going it alone can be daunting. You’ll want to know the potential ramifications of such a decision and what getting divorced in your state will entail. If you’re considering such a step and have questions on family law, you can begin looking for a law firm or reach out to the divorce lawyers at JGL.